


There’s a noisy debate taking place around whether the surging demand for AI justifies the staggering amounts of capital being poured into supplying it. But most of this commentary is happening without looking closely at what buyers are actually doing in the real world.
So rather than pontificating about it, I decided to gather some data myself.
Since early August I’ve been pulling daily usage metrics from OpenRouter, which connects developers to about 400 models across more than 80 different providers and tracks aggregate token consumption per model every day. It offers a unique glimpse into genuine revealed preference at scale: not what buyers claim they want, nor what the foundation labs market, but which specific models are actually carrying the workloads.
I was testing a specific idea, one that predates today’s AI wars considerably. One of Clayton Christensen’s lesser-cited observations is that disruption doesn’t begin when a cheap competitor arrives, but when the market leader starts supplying more performance than mainstream customers can absorb. He called it overshooting — the point at which further improvement stops being something buyers will pay for, and competition shifts to price, convenience, or something else entirely.
Answering this question right now is harder than it looks.
What the data does say
Measured on input token rates, roughly 80% of all routed volume is flowing to models priced under $1 per million. Options at $5 or more account for 3.3%.
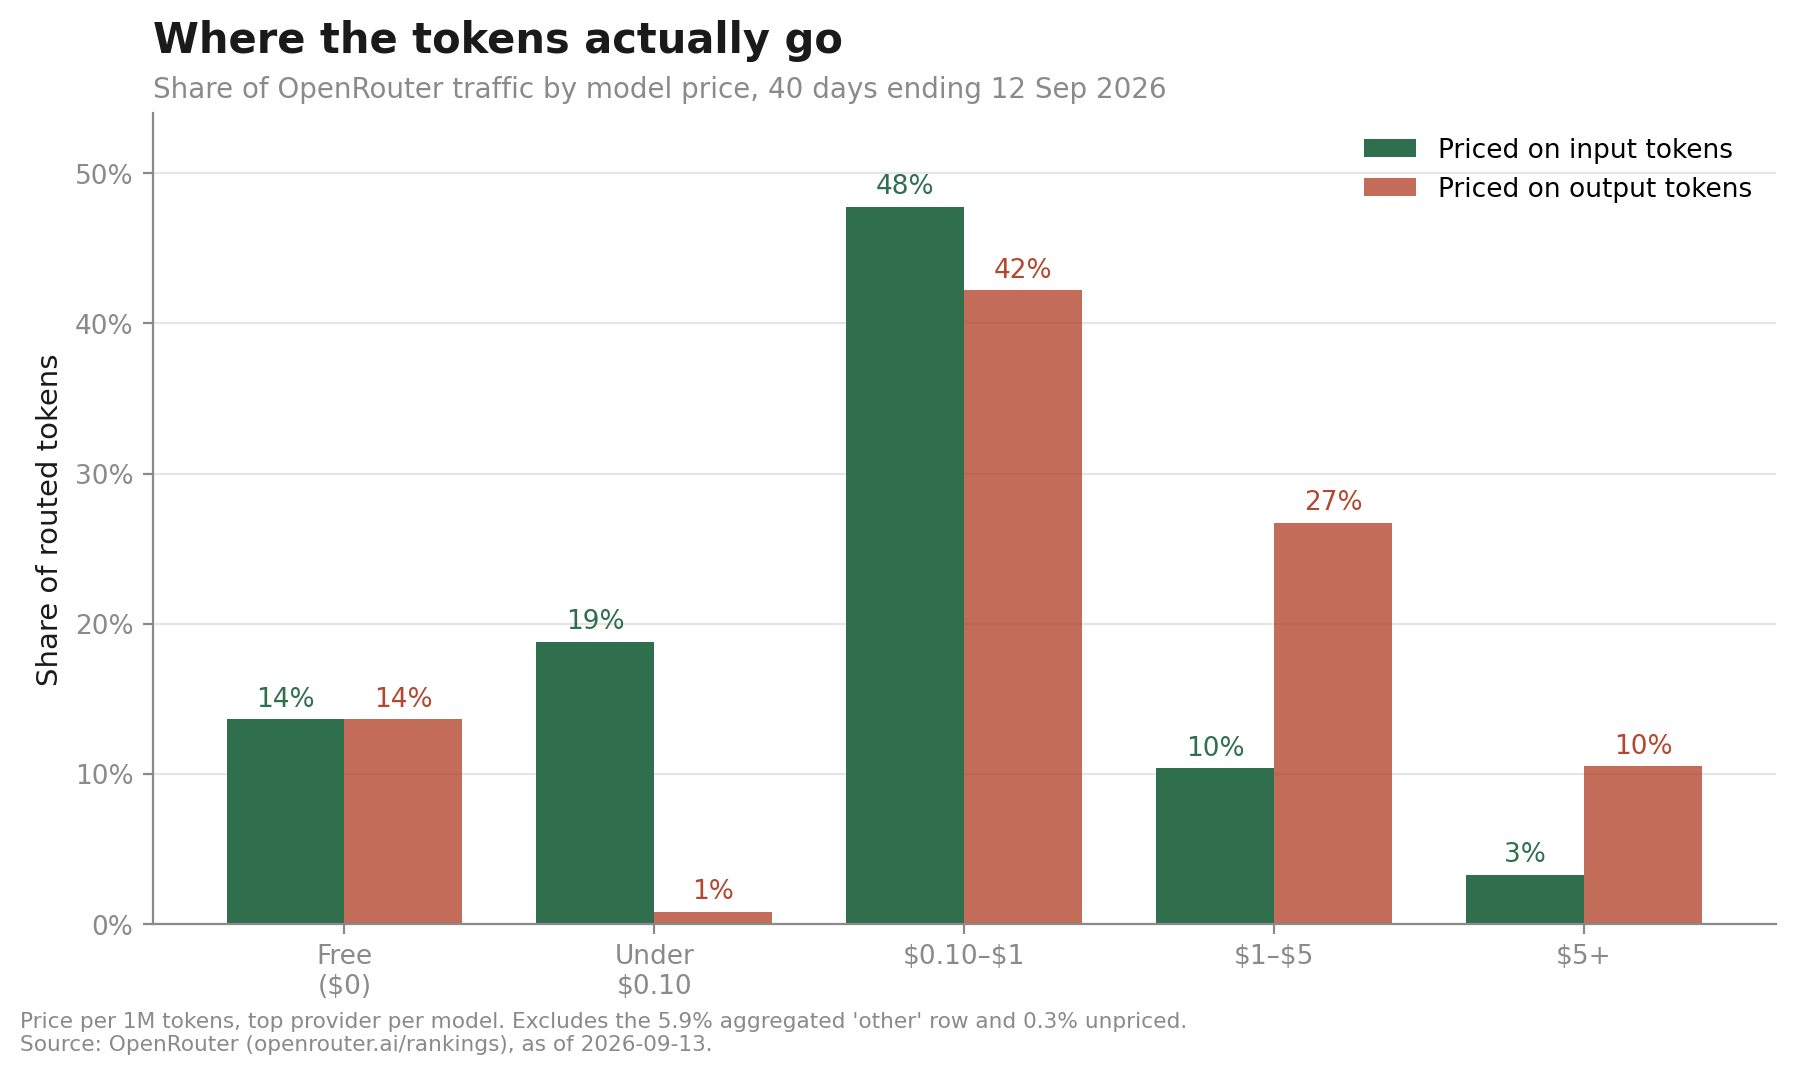
The most expensive model carrying any meaningful traffic maxed out around $10 per million; premium options listed at fifteen times that saw virtually zero usage.
This largely aligns with what most industry observers, including me, have been suggesting. Low-cost open-weight alternatives aren’t a niche phenomenon here. They’re becoming the dominant choice.
Total volume also grew about 68% over five weeks, from 74 trillion to 124 trillion tokens per week. Whatever else is uncertain, overall demand for inference is not the problem.
Two ways to read the same bill
Now look at that identical traffic priced on output tokens instead of input.
The picture changes materially. On input pricing, 80% of volume sits below $1 per million and 3.3% above $5. Price the very same tokens on output rates and only 57% is under $1, while 10.5% is above $5 — 3X as much.
This matters because output is where the real spend happens. Output tokens carry a premium almost everywhere, and reasoning-heavy models produce vastly more of them, with extended thinking chains consuming multiples of the original input length.
The token price wars being touted in the media are largely a story about the cheap half of the ledger. They don’t necessarily translate into lower total invoices.
It’s important to be careful here, because I initially thought I had a stronger signal. Tracking both measures weekly, the output-priced share under $1 fell from 63% to 45% while the input-priced share rose — a clean divergence suggesting output was actively repricing upward. But on closer review, that didn’t hold. Across the full window there were 50 increases in output pricing against 65 decreases, and per model, first price to last, 9 went up, 9 went down and 3 were flat. Every one-way increase came paired with a cut elsewhere in the same vendor’s lineup. Yes, the models carrying volume in September do cost more on output than the ones they displaced — but that’s portfolio composition, not a market repricing.
Three things that fooled me
That wasn’t the only thing I got wrong, and the failures are more instructive than the findings.
The disappearing premium tier. The $5-and-up tier at first looked like it was collapsing: share down from 6.1% to 2.4%, and absolute volume down 34% while the market grew 68%. A premium tier shrinking in absolute terms inside a market expanding by two-thirds is almost a textbook picture of performance oversupply.
Except it wasn’t happening. On 18 August one model vendor cut a single model from $5 per million to $2.50, then to $2 four days later. That change alone moved 1.64 trillion tokens a week out of the band — more than the entire 1.53 trillion decline I’d measured. Hold that model’s price at its starting level and the tier’s volume goes up 2%. No buyer’s behaviour changed, rather a vendor changed their pricing and everything adjusted.
Models going to zero. Several expensive models stopped appearing entirely, which read as demand evaporating. But OpenRouter publishes the top 50 models by volume plus one aggregated row for everything else. Falling out of the top 50 doesn’t mean going to zero — it means going into the “everything else” bucket, currently about 6% of all tokens. Four models exited during my window carrying 1.07 trillion weekly tokens, and their successors arrived with almost exactly the same volume, 1.09 trillion. In other words, this is a generational handover, not a collapse.
Prices that move without anyone repricing. Catalog prices are the top provider’s price, and most high-volume models are served by several hosts at different rates. When routing shifts between them the recorded price changes even though no actual decisions took place. One popular model flipped across the $0.10 threshold seven separate times in forty days, each crossing moving 8–14% of that day’s tokens across a tier line. One provider alone accounted for 32 price increases and 42 decreases, flipping back and forth within days.
The high degree of change in such a relatively short period should make anyone cautious about the token-price charts being circulated by both bull and bear pundits.
So is the frontier overshooting?
It’s still an open question that’s not - yet - answerable from consumption data.
Overshooting is a claim about the gap between capability supplied and capability required. What this data measures is capability chosen. The tokenmaxxing era was thankfully short, but it remains true that nobody gets fired for buying the expensive option, at least not at this stage of the market. Corporate inertia pushes revealed preference toward overpaying in ways that can’t be easily discerned from the outside.
What I can say is that the clear majority of real workloads are running well below the top of the market, and have been for at least as long as this observation period. But the move toward cheaper options is coming out of the middle of the price range rather than out of the top, which looks more like ordinary price competition than a softening of demand. And volume in the most expensive tier held roughly flat while the market grew two-thirds.
Answering the important question means measuring what specific jobs actually require. That means taking real business workloads — field extraction, classification, query generation — and running each down the full model ladder to find the cheapest option that gets the job done, against a threshold fixed and published before the results are in. There’s undoubtedly significant use of more powerful models than necessary going on in many organizations, but buyers are getting smarter and vendors have every incentive to adjust their pricing to keep them on board.
Why this is worth watching
It’s worth recalling, as I did in my last post, that two of the most significant AI acquisitions this year targeted infrastructure operating below the frontier rather than the frontier labs themselves. Stripe acquired OpenRouter for over $7 billion to secure the routing layer; Nvidia reportedly committed $12.9 billion for Hugging Face, the open-weight repository hub. Neither bought a foundation model company.
The Smart Money Looks Downstream

There’s been no shortage of breathless commentary lately about AI’s circular financing loops, mounting data center debt loads, and the supposed concentration of this entire market - some suggest the entire economy - on the shoulders of OpenAI and Anthropic. But while skeptics fret about whether the frontier labs will ever be able to generate the softwar…
If raw capability were the only scarce asset, value would concentrate at the frontier. Where it’s actually accruing is in the layers that help buyers decide how much capability to purchase, and from whom.
Disruption will come to this market eventually, as it does to all markets. Whether it’s arriving now is a measurement problem, and the current measurements aren’t good enough, especially with highly fluid - and in many cases subsidized - pricing. We’ll keep collecting data, and will update when there’s enough history to say more about direction rather than level.
Data source: OpenRouter (openrouter.ai/rankings), through 13 September 2026. Pricing reflects per-1M token rates from the leading provider per model, calculated against that day’s own catalog snapshot and never carried forward. Price tiers are fixed absolute boundaries, never re-cut against the data. Unpriced models and OpenRouter’s aggregated “other” bucket (5.9% of tokens) are tracked independently rather than distributed across tiers. Newly released models miss their launch day, when the catalog snapshot precedes the release — up to 2.4% of tokens on such a day. Token counts come from each provider’s own tokenizer and are not strictly comparable across providers.