


First of all: this has been a fantastic World Cup.
I often say that watching soccer is like watching golf — if you’ve played it, you can appreciate what’s happening; if you haven’t, it can be a slog. I’ve watched a lot of soccer these past few weeks, and this tournament has been the opposite of a slog. It’s been three weeks of the best stuff.
Not to mention that here in New England we’ve had some great side plots. The Tartan Army literally drank Boston dry - which many didn’t think was possible. And then there’s my sentimental favorite Norway (my family heritage) - watching them row their way through the group stage has been a delight.
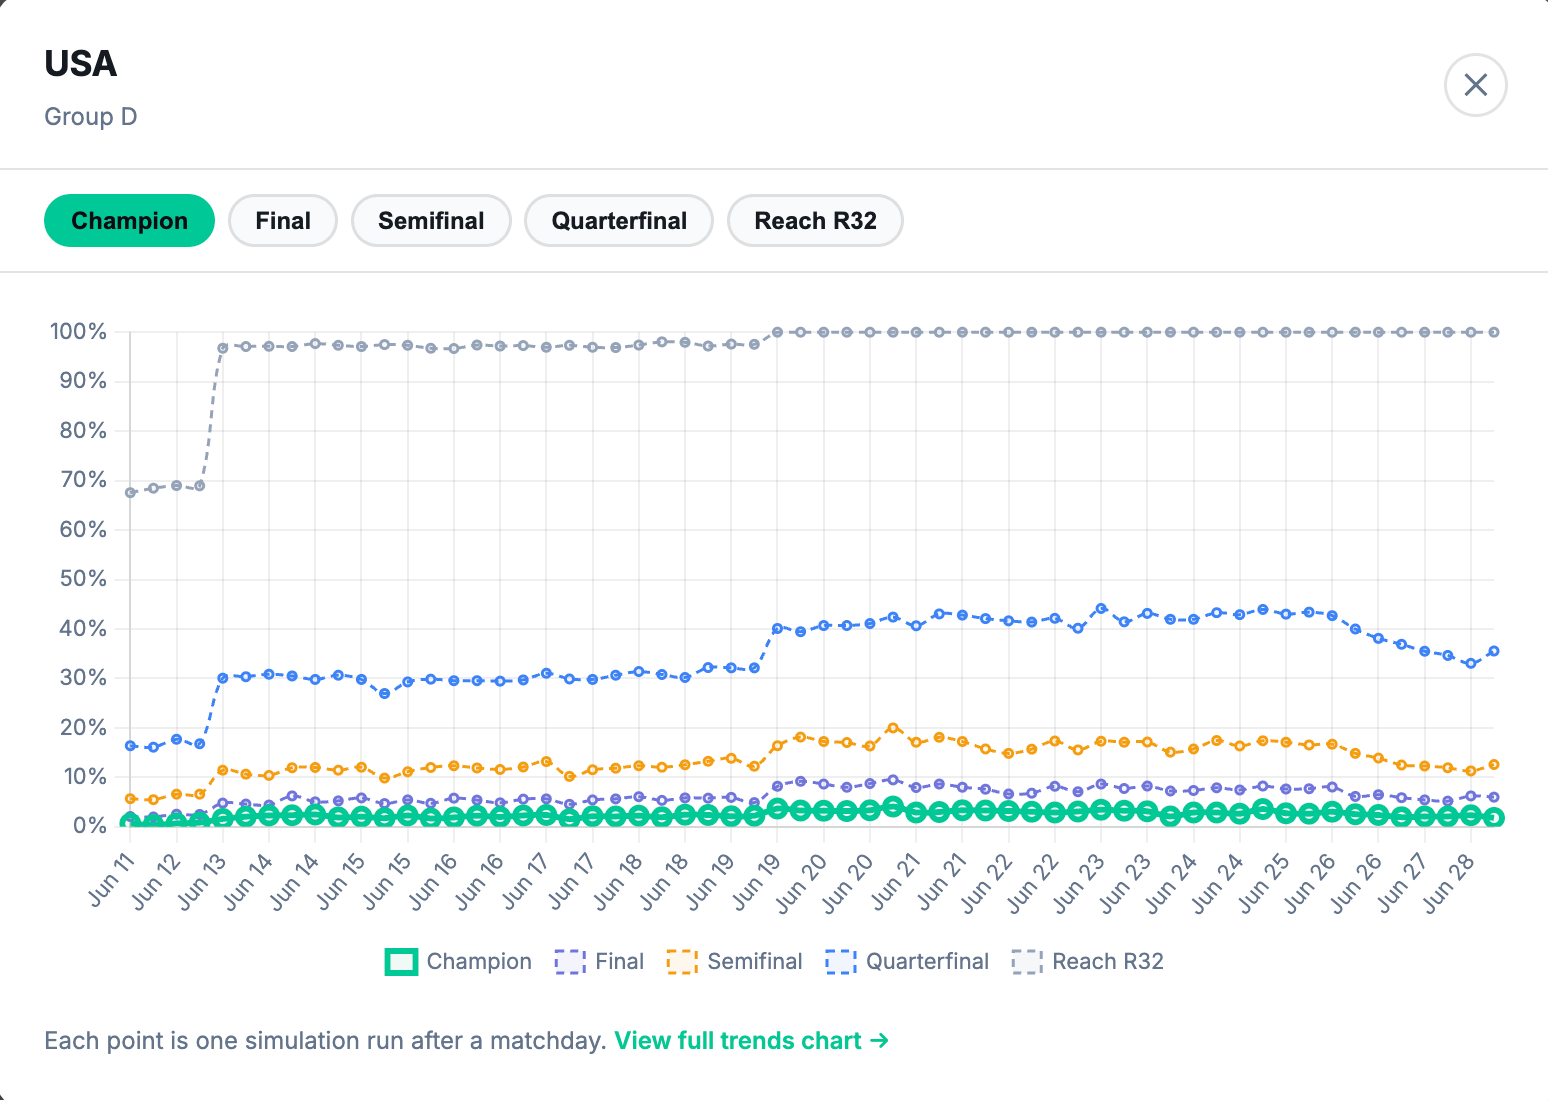
Also credit to Mauricio Pochettino. I’ve spent a lot of years trying to watch the USMNT, and this is the first time I really feel like I’m actually watching a *team* — not just a collection of athletes. I’ve played - and coached - a lot of soccer, and one thing the game teaches you, over and over, is that it’s a team sport in a way Americans don’t always appreciate. We tend to over-celebrate individual athleticism over the unglamorous stuff — spacing, movement off the ball, eleven players solving a problem together. This USMNT finally looks like a true team. Credit to them and the coach who catalyzed it, however far their run goes.
Anyway, on to the model.
The scoreboard
Three weeks ago we launched a World Cup “living” forecast model1 — a live demonstration of research that commits before the fact instead of explaining itself after. Every prediction locked and cryptographically hashed before kickoff. Methodology fully public. A scorecard that updates after every match, including the ugly ones.
The group stage is done. All 72 matches were predicted, locked, and scored. Here’s how it went.
The model called the right outcome 43 times out of 72 — 60%. The betting market called 48 — 67%. On Brier score, which is the standard way to grade probabilistic predictions, the model came in at 0.540 against the market’s 0.450. Lower is better, so: the model lost. Consistently. It never beat the market over a full phase of the tournament.
That was the expected outcome - and it’s also the point.
The model lost because of draws, and that’s the whole story
20 of 72 group matches ended level. The model — like every model built on team-strength ratings — is bad at draws. They don’t get predicted so much as left over, and when a bunch of tight and cautious opening-round games finish 1-1, the model eats the cost every time.
The market is better at this, because the market isn’t really a model. It’s everyone with money on the line, including people who know *this particular match* is going to be a grind for reasons that never show up in a rating.
Which gets at what the group stage actually demonstrated.
The gap between the model and the market isn’t a failure - it’s a measurement
The model knows exactly one thing about each team: how good they are, updated from results. It does not know who’s injured. It doesn’t know that a team has already qualified and is resting starters (such as the US resting 9 starters against Turkiye). It doesn’t know that another team is eliminated and just playing for pride. It doesn’t - and can’t - read the news.
The betting market, of course, knows all of this, and prices it in.
So the gap between them — that 0.09 on the Brier score — isn’t a mystery. It’s the value of everything the model can’t see. Lineups, motivation, injuries, who needs what from the table. And the only reason we can point at that number and tell you what it represents is that the model is simple enough to be honest. When it’s wrong, it tells you exactly why: it priced a full-strength USA against Turkiye, and Coach Poch (wisely) rested most of the squad. The market is more accurate and can’t tell you a thing about what it knows or why.
Those are two different tools. The market is built to be right. The model is built to be explainable. The space between them is the data I actually care about.
The vibe-coded model vs the “supercomputer”
Sports Illustrated ran Opta’s post-group-stage projections this morning — the “supercomputer” predicting the winner. Opta is the real deal, an industrial forecasting operation with far more going into it than my deliberately blind little teaching model. So it’s worth seeing where a one-channel strength model - vibe-coded in a few hours - lands next to the supercomputer.
At the top? Basically the same answer. Opta’s three standouts are France (18.7%), Argentina (16.3%), and Spain (13.5%). The model’s top three are the same three teams — Argentina (19.1%), Spain (17.4%), France (11.7%) — shuffled in order but unmistakably the same tier, with the same clear gap down to everybody else. Two models built on completely different philosophies agree on who the likely winners are.
Where they split is the interesting part. The model likes Colombia a lot more than Opta does (7.3% vs 3.2%), and prefers Argentina over France. Both of those trace straight back to how the model works: it learns only from results, and Colombia and Argentina had excellent, clean group stages. A pure strength model rewards exactly that. Opta, with more inputs, smooths those swings back toward what it expected before the tournament. Nobody’s been proven right yet. The knockouts decide it — which is the whole point of locking both sets of numbers down before kickoff.
What happens now
The Round of 32 starts this afternoon, and the first knockout predictions are already locked. Two things change from here, and both work against the model: the games get tighter, and the stakes get higher — which is exactly when the market’s edge over a blind strength model is biggest. If the model holds up anyway, that’ll be a pleasant surprise. If it gets taken apart, that’s the cleanest demonstration yet of what a strength-only model can - and can’t - see.
Either way, it’s already on the record.
The model, the data pipeline, and every update along the way were done in collaboration with Claude, primarily in Claude Code using the Fable model (while it was available) and since then Opus and Sonnet. The whole thing — Cloudflare Workers, the database, the prediction-locking, the scoring — was scaffolded and is maintained that way. Fitting, for a project about what happens when you point AI at a hard forecasting problem and make it show its work.